Ask any golfer how their putting was last round and they’ll give you one of two answers: putts per round, or putts per GIR. Both feel useful. Both are misleading.
Here’s why — and what strokes gained data reveals instead.
The Problem with Putts Per Round
Putts per round is the most common putting stat in golf. It’s also one of the most context-free numbers you can track.
If you miss every green and chip it to tap-in range, you might shoot 27 putts and feel like a putting god. If you’re hitting it to 25 feet all day, 33 putts might actually represent elite performance. The raw number tells you nothing without knowing where the ball was when you started putting.
Putts per GIR is better — at least it filters for greens hit — but it still ignores distance. A 30-footer and a 6-footer both count the same. That’s a problem.
What Strokes Gained: Putting Actually Measures
Strokes Gained Putting solves this by benchmarking every single putt against a baseline. Instead of counting putts, it asks: how did this putt compare to what a PGA Tour player would be expected to take from the same distance?
From 5 feet, a Tour player makes it about 81% of the time — so the baseline expectation is roughly 1.19 strokes. If you one-putt it, you gained 0.19 strokes. If you two-putt it, you lost 0.81. If you three-putt, you lost 1.81.
Every putt gets evaluated. Every putt adds or subtracts from your total. By the end of a round, you have a number that’s actually meaningful.
The Metrics That Matter
When we look at putting performance inside PARfect Performance, we break it down into a few key categories:
Strokes Gained: Putting (total) Your overall putting performance versus a scratch baseline across the full round. This is the headline number — positive means you gained strokes on the field, negative means you gave them away.
Strokes Gained: Putting (by distance) Breaking strokes gained down by putt length tells you where you’re gaining and losing. Some players are elite from inside 10 feet but bleed strokes on lag putts. Others have excellent distance control from long range but miss too many short ones. You can’t fix what you can’t see.
Make % by Distance Band How often are you converting from inside 5 feet? From 5–10? From 10–20? Most players have a distance band where their make percentage drops off a cliff — and they don’t know it until they see the data. This is where three-putts live.
3-Putt Reason Are you three putting because of the lag putt or because you missed the short putt? That’s an important distinction that will then guide your practice.
Good Speed % This one is underrated. Depending on the distance to the hole PARfect defines good speed differently, but are you hitting most of your putts within that? Pace control is believed to be the most important skill in putting by a lot of players and coaches. Is your pace tour ready? Find out.
The Benchmark Question
One thing coaches consistently ask us: what’s good?
Here’s a rough reference using PGA Tour putting benchmarks:
| Distance | Make % (PGA Tour) |
|---|---|
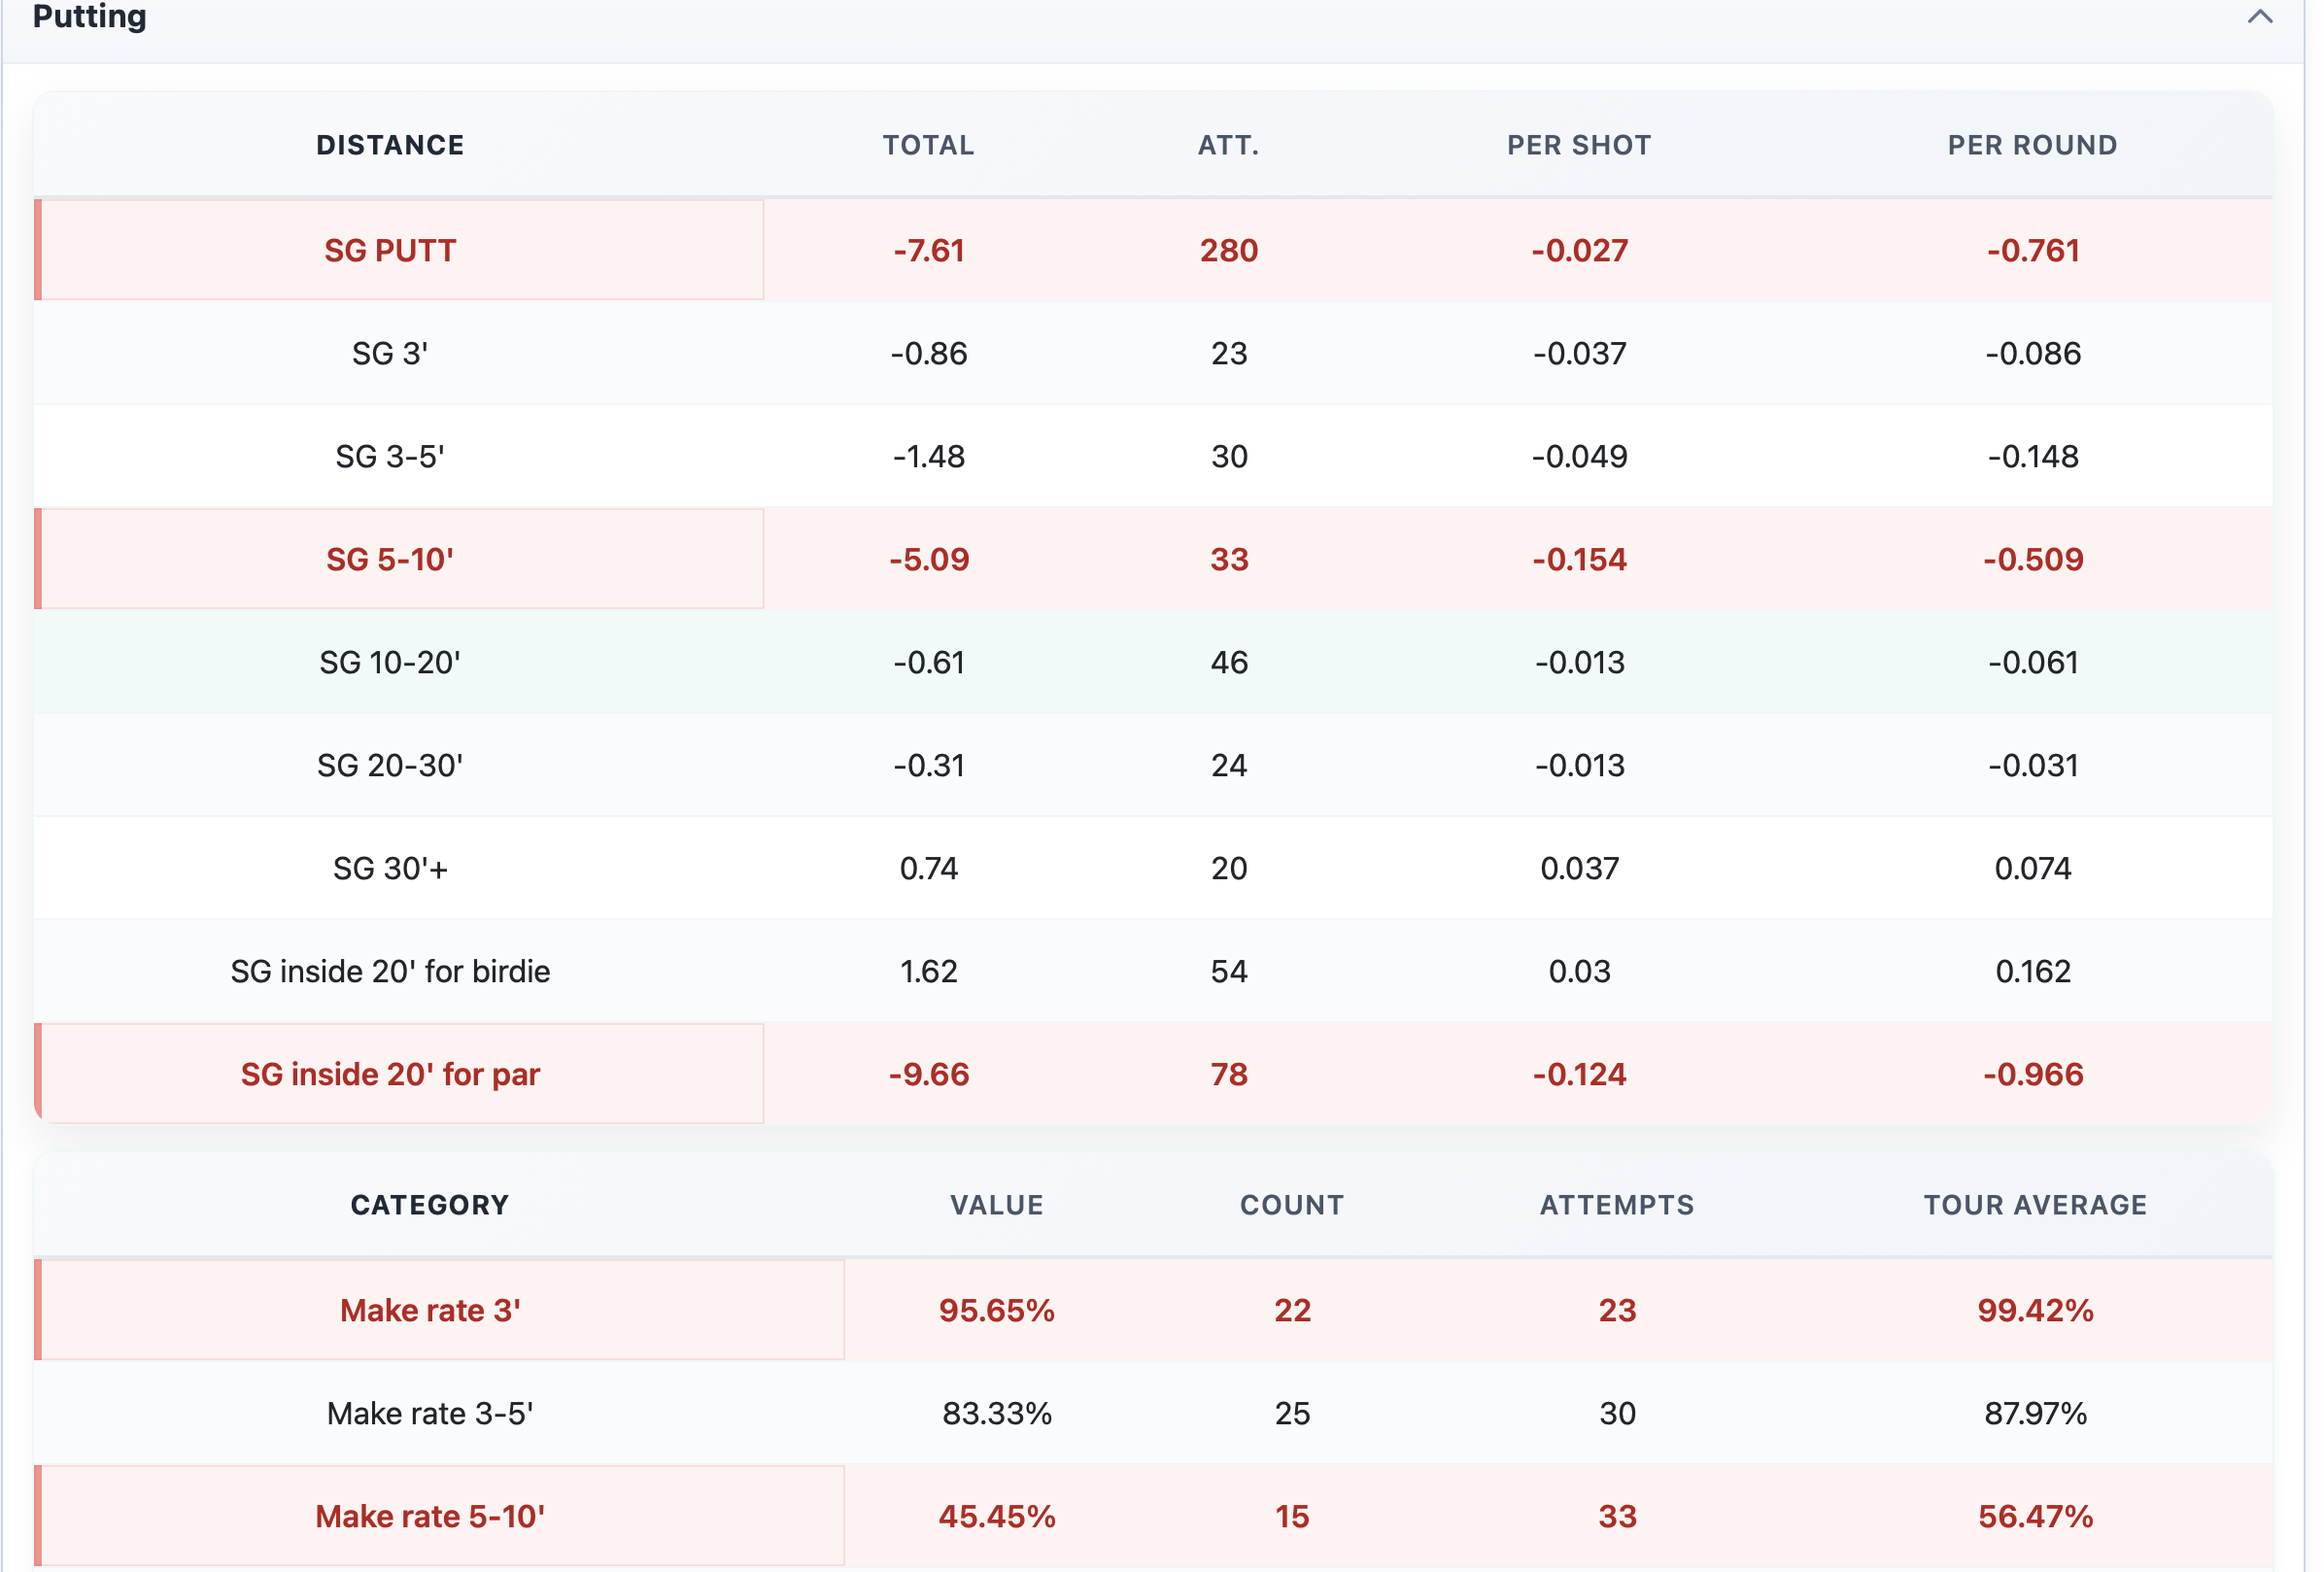
| 3 ft | ~99% |
| 3–5 ft | ~88% |
| 5–10 ft | ~56% |
If your players are meaningfully below these numbers in any band, you’ve found something worth working on. If they’re tracking close or above, the gains are probably elsewhere.
Putting Stats in the Context of a Full Round
One more thing worth saying: putting stats don’t exist in isolation.
A player with poor approach play is going to have more 30-footers than a player who hits it close. Their SG might look similar, but the underlying stories are different. That’s why strokes gained works best as a system — approach, around the green, putting, off the tee — all benchmarked together so you can see where a round was actually won or lost.
Putting matters enormously. But knowing how it matters, and why, is what separates data-driven improvement from just grinding on the putting green and hoping something changes.
Have a look at our previous post to get more insight into the world of golf statistics and PARfect Performance: Why Round Entry Has to Be Simple